contact them if you have any trouble MainlandChina@worldquantbrain.com
get 10000 points to become a constant
2000/day most
https://platform.worldquantbrain.com
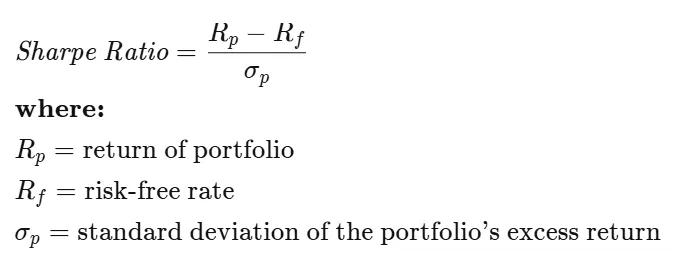
Sharpe Ratio
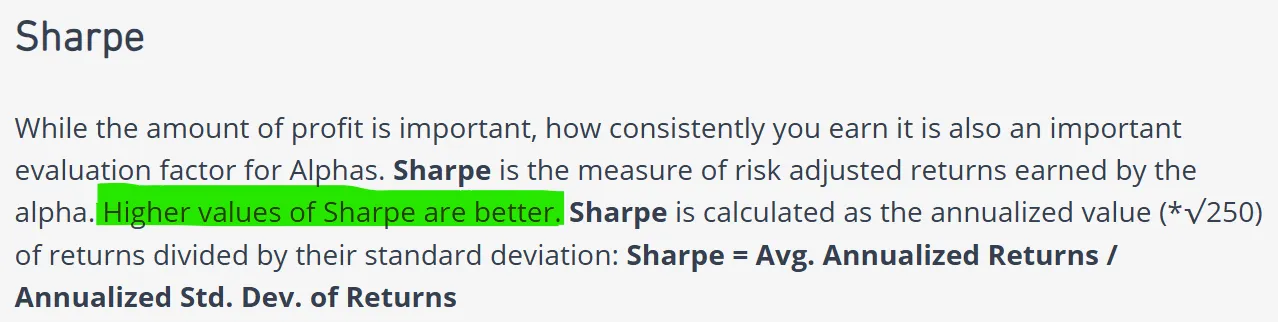
The Sharpe ratio compares the return of an investment with its risk. It’s a mathematical expression of the insight that excess returns over a period of time may signify more volatility and risk, rather than investing skill.
Turnover
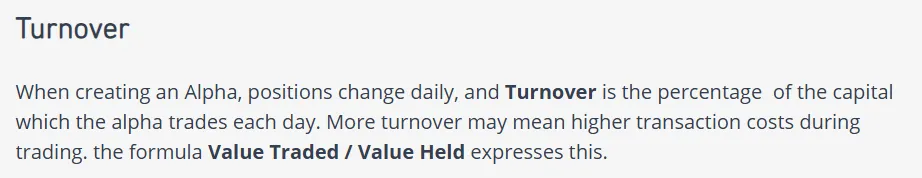
Turnover is how quickly a company has replaced assets within a specific period. It can include selling inventory, collecting receivables, or replacing employees. It can also represent the percentage of an investment portfolio that is replaced.
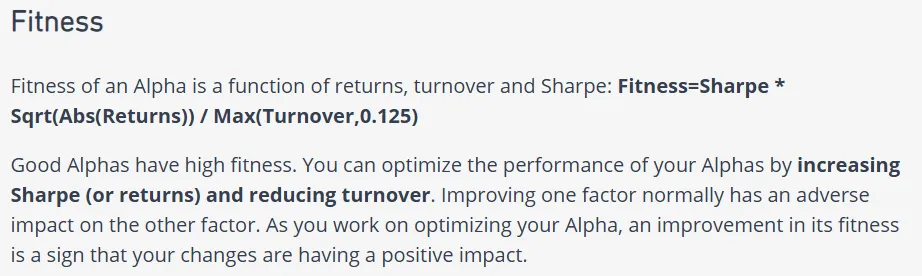
Fitness
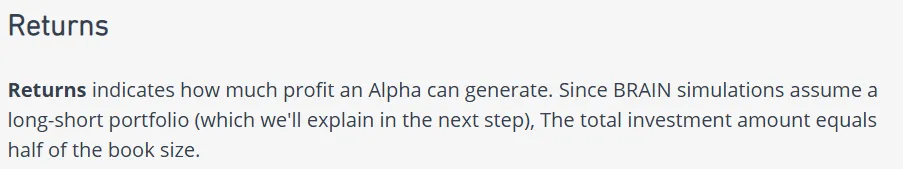
Returns
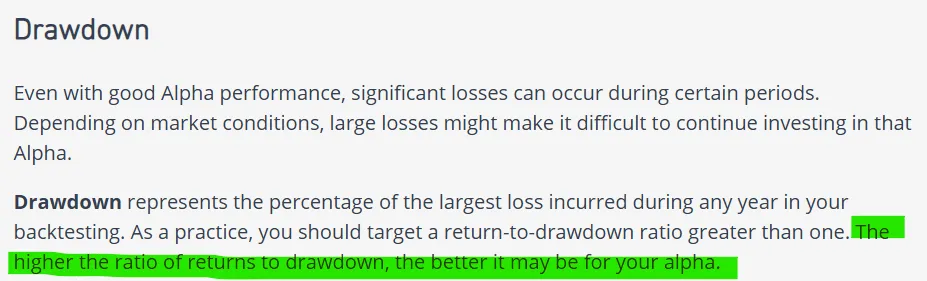
Drawdown
What is a Drawdown in Investing?
In finance, drawdown (DD) measures the decline in the value of an investment, portfolio, or trading account from its peak to its lowest point (trough) before recovering. It is typically expressed as a percentage drop from the peak value and is a key metric to assess risk, volatility, and potential losses.
1. Key Concepts
(1) Maximum Drawdown (MDD)
- The largest peak-to-trough decline over a specific period.
- Represents the worst-case loss an investor would have suffered if buying at the peak and selling at the bottom.
- Formula:
(2) Drawdown Duration
- The time taken for the investment to recover from the trough back to its previous peak.
(3) Relative vs. Absolute Drawdown
- Absolute DD: Measured in nominal terms (e.g., “$10,000 loss”).
- Relative DD: Percentage decline (e.g., “20% drop”).
2. Why Drawdown Matters
- Risk Assessment: High drawdowns indicate higher volatility and potential emotional stress for investors.
- Strategy Evaluation: Trading algorithms or funds with lower MDD are often considered more robust.
- Survival Risk: Severe drawdowns may force liquidations (e.g., margin calls in leveraged trading).
3. Example Calculation
Suppose an investment portfolio moves as follows:
- Peak Value: $100,000
- Trough Value: $70,000
- Recovery to $100,000: Takes 6 months
Drawdown:
- Maximum Drawdown (MDD): 30%
- Drawdown Duration: 6 months
4. Drawdown vs. Other Risk Metrics
| Metric | Focus |
|---|---|
| Drawdown | Peak-to-trough loss |
| Volatility | Standard deviation of returns |
| Beta | Sensitivity to market moves |
| Value at Risk (VaR) | Worst loss within a confidence interval |
5. How to Reduce Drawdowns
- Diversification: Spread risk across uncorrelated assets.
- Stop-Loss Orders: Automatically exit losing positions.
- Risk Management: Limit position sizes (e.g., 1-2% of capital per trade).
- Hedging: Use options or inverse ETFs to offset losses.
6. Real-World Context
- 2008 Financial Crisis: S&P 500 had a ~56% MDD.
- Crypto (2022): Bitcoin’s MDD exceeded 75%.
- Hedge Funds: Those with >20% MDD often face investor redemptions.
Key Takeaway: Drawdowns are inevitable, but managing their magnitude and duration is critical for long-term success. Would you like a case study on a specific asset?
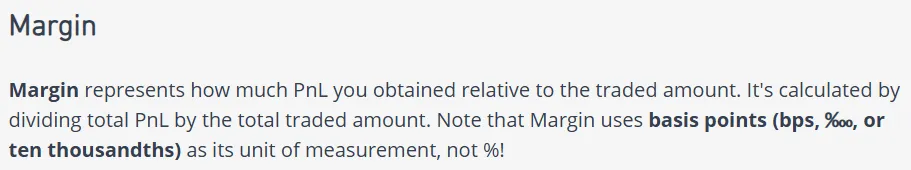
Margin